Draw your process.
See the schedule and cost.
For the people who get asked ‘when will it ship?’ and have to put a date on it. Caladia turns a block diagram into a P80 schedule and cost
— before the deadline gets committed.
A complete planning workshop, in your browser.
Most teams split planning across MS Project, Excel, and a whiteboard. Caladia does it in one.
P80 cost beside P80 date, from the same Monte Carlo run.
Resource rates, per-use charges, and node fixed costs with their own distributions all flow into every simulation. Get the cost tornado: which activities drive your budget risk, ranked independently from which drive your schedule risk. Cumulative cost S-curve with P10–P95 bands. Currency-converted display totals from bundled, pinned-at-save FX snapshots.
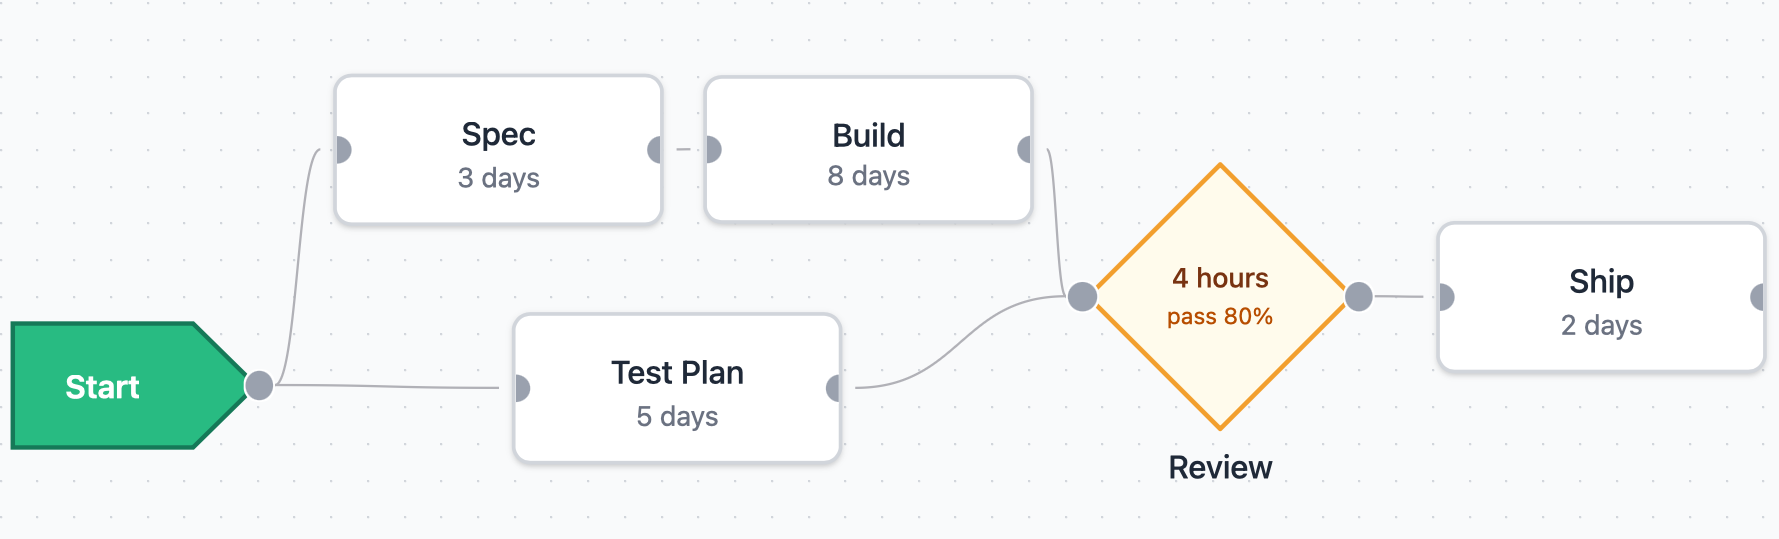
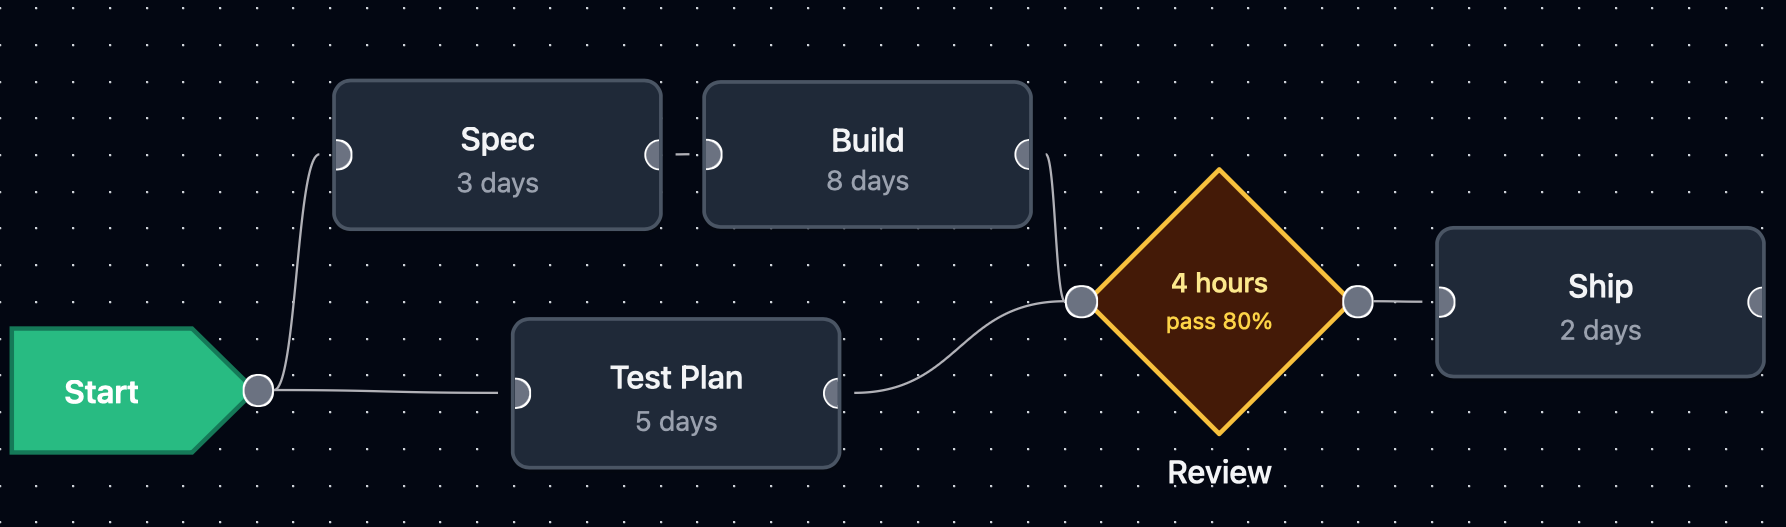
Block diagram canvas
Drag activities, decisions, and start/end nodes. FS, SS, FF, and SF dependencies with signed lag. Multi-select, copy/paste, full undo history.
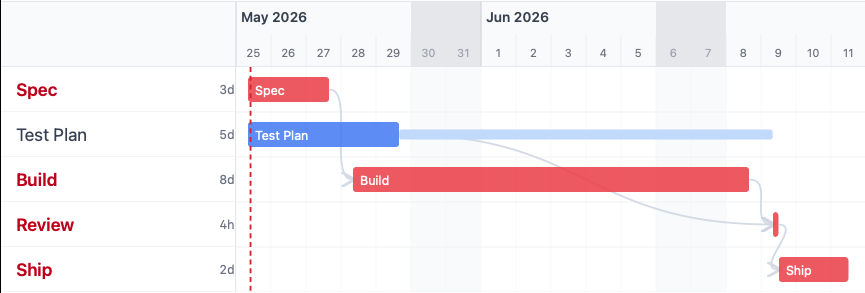
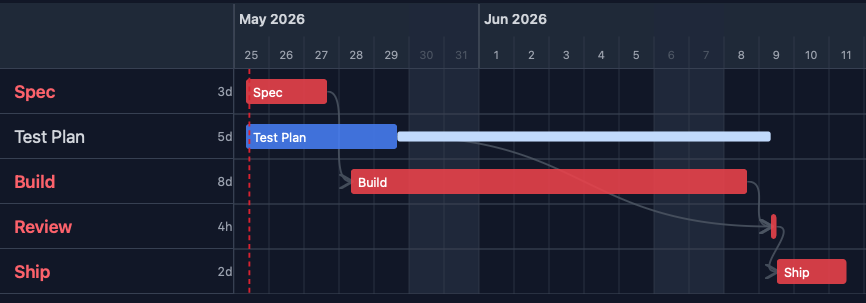
Live Gantt chart
Auto-updates on every edit. Critical path highlighted, non-working days shaded, dependency arrows, collapsible loop groups, dark mode.
Monte Carlo simulation
Triangular, PERT-beta, or normal distributions per node. Seeded reproducible runs. P50/P80/P95, criticality index, tornado chart.
Decision gates
Diamond-shaped review nodes with a pass probability and a failure delay. Failed reviews extend the chain rather than branching it.
Loops & iterations
Wrap nodes into iterative loops with configurable kickout: max iterations, time budget, convergence, or external trigger. Iteration counts modeled in Monte Carlo.
Resources & calendars
Resource pools with custom calendars. Per-assignment conflict policy: intersection, resource-wins, or activity-wins. Utilization histogram included.
Scenario comparison
Create named what-if scenarios by overriding node durations. Compare deterministic CPM results side-by-side. See critical-path changes and working-day delta at a glance.
Sub-system blocks
Wrap a group of nodes into a single visual block with one entry and exit. Drill in to edit, save out as a reusable .calasub file.
AI-guided imports
Bring an MS Project file, a Gantt spreadsheet, or a process slide deck. Caladia ships a portable LLM authoring skill — use any model you want, with no embedded API key.
This is the real app.
Same project as above: drawn, then scheduled.
Three steps, no account required.
From cold start to a working schedule.
Sketch the process
Drag in nodes, draw arrows, name things. The canvas feels like a whiteboard — only it knows about durations and dependencies.
Add the metadata
Click any block to set duration, distribution, resources, and lag. Each field has a sensible default — fill what matters.
Read the schedule
The Gantt updates live. Run Monte Carlo to see both schedule and cost percentiles. Compare what-if scenarios. Save to a .cala file when you’re done.
Caladia is for planning, not tracking.
Model your project before you commit to a deadline. Then hand the plan to whatever tracker your team already runs on. Caladia is the step before execution, not a replacement for it.
Use Caladia for
- Modelling a project before you commit to a deadline
- P80 schedule and P80 cost forecasts
- What-if scenarios and ranked risk drivers
- Iterative or decision-heavy processes
- Re-planning when scope changes
Use Jira, Asana, monday, or ClickUp for
- Day-to-day task assignment and tracking
- Status workflows (todo → in progress → done)
- Sprints, burndown, team velocity
- Real-time collaboration and comments
- SSO, audit trails, enterprise integrations
One plain-JSON file, readable in any editor.
The project format is a documented Zod schema, validated on every load. There’s no proprietary blob to get locked out of, and no vendor who can disappear and take your plans with them.
The plan you wish MS Project gave you.
Open a tab and put a date on it.